Why Expected Goals (xG) Don't Always Win Matches
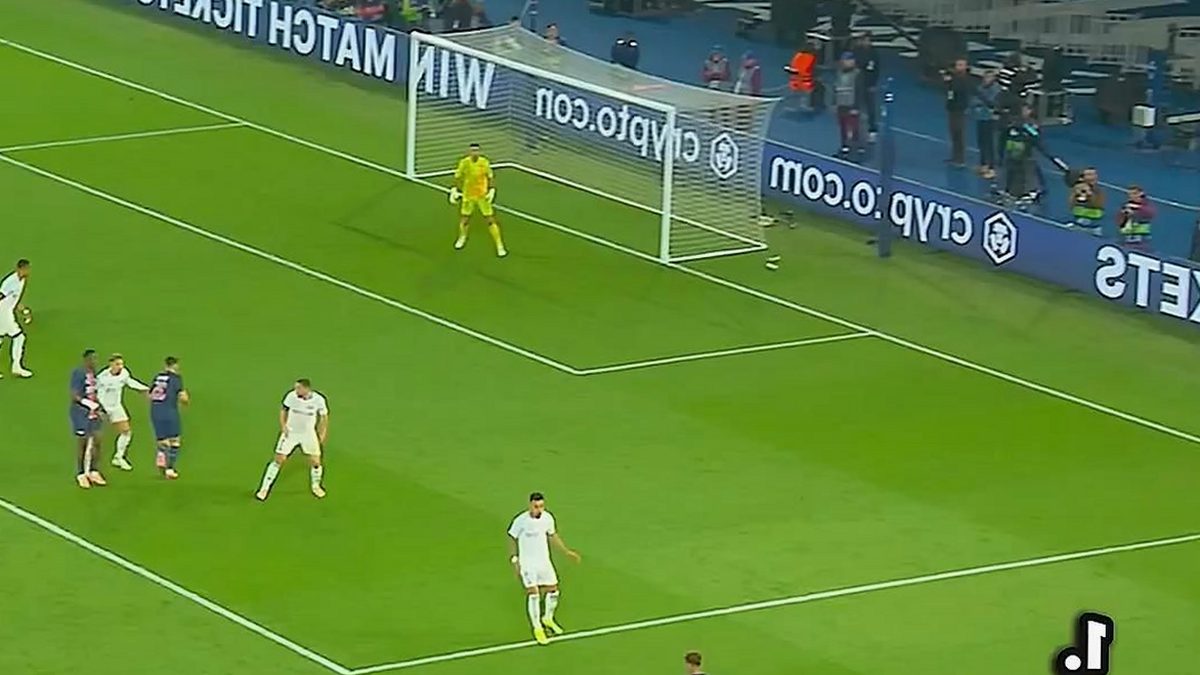
Why Expected Goals (xG) Don't Always Win Matches I was sitting in the stands during a midweek Championship clash when it happened again. My team, Norwich City, had just lost 1-0 to Blackburn Rovers. The final whistle blew, and the home fans around me groaned—because of the defeat, and above all because the xG told a different story.

2.8 to 0.7 in our favor. Eight clear chances, two posts, a saved penalty, and a goal disallowed for offside that even the linesman looked unsure about.
Yet the scoreboard read zero. That's when the guy behind me muttered, "What's the point of expected goals if we still lose?" That question stuck with me.
Because he's not wrong. Expected goals, or xG, have become the holy grail of advanced football stats, splashed across pre-match graphics and post-game analysis like they hold the secret to football itself. But what does it actually mean when your team racks up 2.5 xG and still walks away empty-handed?
And more importantly, how can you use it to make smarter predictions without feeling like you've been tricked by numbers? Let's start with the basics. Expected goals (xG) measure the quality of a scoring chance. Every shot is assigned a probability between 0 and 1 based on where it's taken, the type of pass that led to it, whether it was a header or a volley, and even the position of the defenders.
A tap-in from two yards out might be worth 0.8 xG—an 80% chance of going in. A speculative effort from 30 yards? Maybe 0.05. Add up all those probabilities during a match, and you get a team's total xG.
It's not about how many shots you take; it's about how good those shots are. The beauty of the xG model is that it cuts through the noise. A team can pepper the box with 20 shots from outside the area, but if their xG is only 0.6, they're probably not creating much.
Meanwhile, a side with just five shots but an xG of 2.0 is carving out real opportunities. That's the kind of insight that makes advanced football stats so powerful—it tells you who's controlling the game, beyond who's running more. But here's the catch: football isn't played on spreadsheets.
A 0.8 xG chance doesn't guarantee a goal. The striker might fluff his touch.
The keeper might pull off a worldie. The referee might blow the whistle for offside just as the ball hits the net.
That's why you'll often see a mismatch between xG and the actual score. In that Norwich game, our 2.8 xG suggested we should have scored at least twice.
Instead, we left with nothing. The difference between xG and actual goals isn't a flaw in the system—it's a reminder that football is chaotic, and sometimes the ball just doesn't bounce your way. Take the 2023 Carabao Cup final between Manchester United and Newcastle.
United won 2-0, but the xG told a different tale: Newcastle 2.1, United 0.9. The Magpies dominated chances, hitting the woodwork twice and forcing a string of saves from David de Gea. Yet two clinical finishes from Casemiro and Rashford sealed the trophy for United. That's the difference between xG and actual goals in action.
Newcastle created better opportunities, but United took theirs. Football, as the cliché goes, is a game of fine margins. Or look at Liverpool's 2021-22 season. They finished with the highest xG in the Premier League (80.1) but ended up with 94 goals—14 more than their xG suggested.
Why? Because Mohamed Salah and Sadio Mané didn't just take shots; they buried them. Liverpool's conversion rate was off the charts, turning half-chances into goals with ruthless efficiency.
That's the kind of overperformance that can make xG look misleading at first glance. But dig deeper, and the numbers still tell the story: Liverpool weren't lucky.
They were clinical. So how do you use xG to predict match outcomes without ending up like my mate in the stands, cursing the stats after another frustrating loss? The key is to treat it as a compass, not a crystal ball. If a team consistently out-creates their opponents in xG but keeps losing, it's a sign they're due a positive swing.
Maybe their finishing is off, or their keeper is having a shocker. Either way, the underlying numbers suggest a turnaround is coming. That's when you start paying attention.
For example, if you're betting or just trying to gauge a team's form, don't just look at the scoreline. Check the xG trend over their last five or six games. Are they creating more chances than they're conceding? If so, the results should follow—unless they're cursed with a striker who couldn't hit a barn door.
Conversely, if a team is winning but their xG is consistently lower than their opponents', it might be time to fade them. They're living on borrowed time.
Here's another way to think about it: xG is like a weather forecast. If the forecast says there's an 80% chance of rain, you'd be foolish not to bring an umbrella.
But if you leave it at home and it stays dry, that doesn't mean the forecast was wrong. It just means you got lucky. Football works the same way.
A team with 2.5 xG is overwhelmingly likely to score at least once. But if they don't, it doesn't invalidate the model—it just means the ball didn't go in this time. Of course, no stat is perfect. The xG model doesn't account for everything.
It can't measure the impact of a red card, a last-minute defensive meltdown, or a manager's tactical masterstroke. It doesn't know if a striker is carrying an injury or if a team is in the middle of a morale crisis.
That's why you should always pair it with context. Watch the game.
Read the mood. And if you're using it for predictions, combine it with other advanced football stats like possession, pressing intensity, or expected assists (xA). If you're new to this, I'd recommend checking out resources like Understat or FBref for xG data—they break it down in a way that's easy to digest, even if you're not a stats nerd. Start by comparing a team's xG to their actual goals over a season.
You'll quickly spot the overperformers and the ones due for a reality check. So, back to that question from the stands: what's the point of expected goals if your team can still lose?
The point is that xG doesn't just tell you who won or lost. It tells you who should have won. And in a game as unpredictable as football, that's a powerful thing to know.
The next time you see your team dominate xG but lose the match, don't throw your scarf in frustration. Instead, ask yourself: was this a one-off, or is there a pattern?
Are they creating chances but missing the finish? Is the keeper standing on his head? Or is the opposition just riding their luck? Because if it's the latter, the numbers suggest the tide will turn.
One tab I always keep open on matchdays: football match analysis.
And when it does, you'll be the one in the stands, smugly nodding at the scoreboard while everyone else wonders how they didn't see it coming.